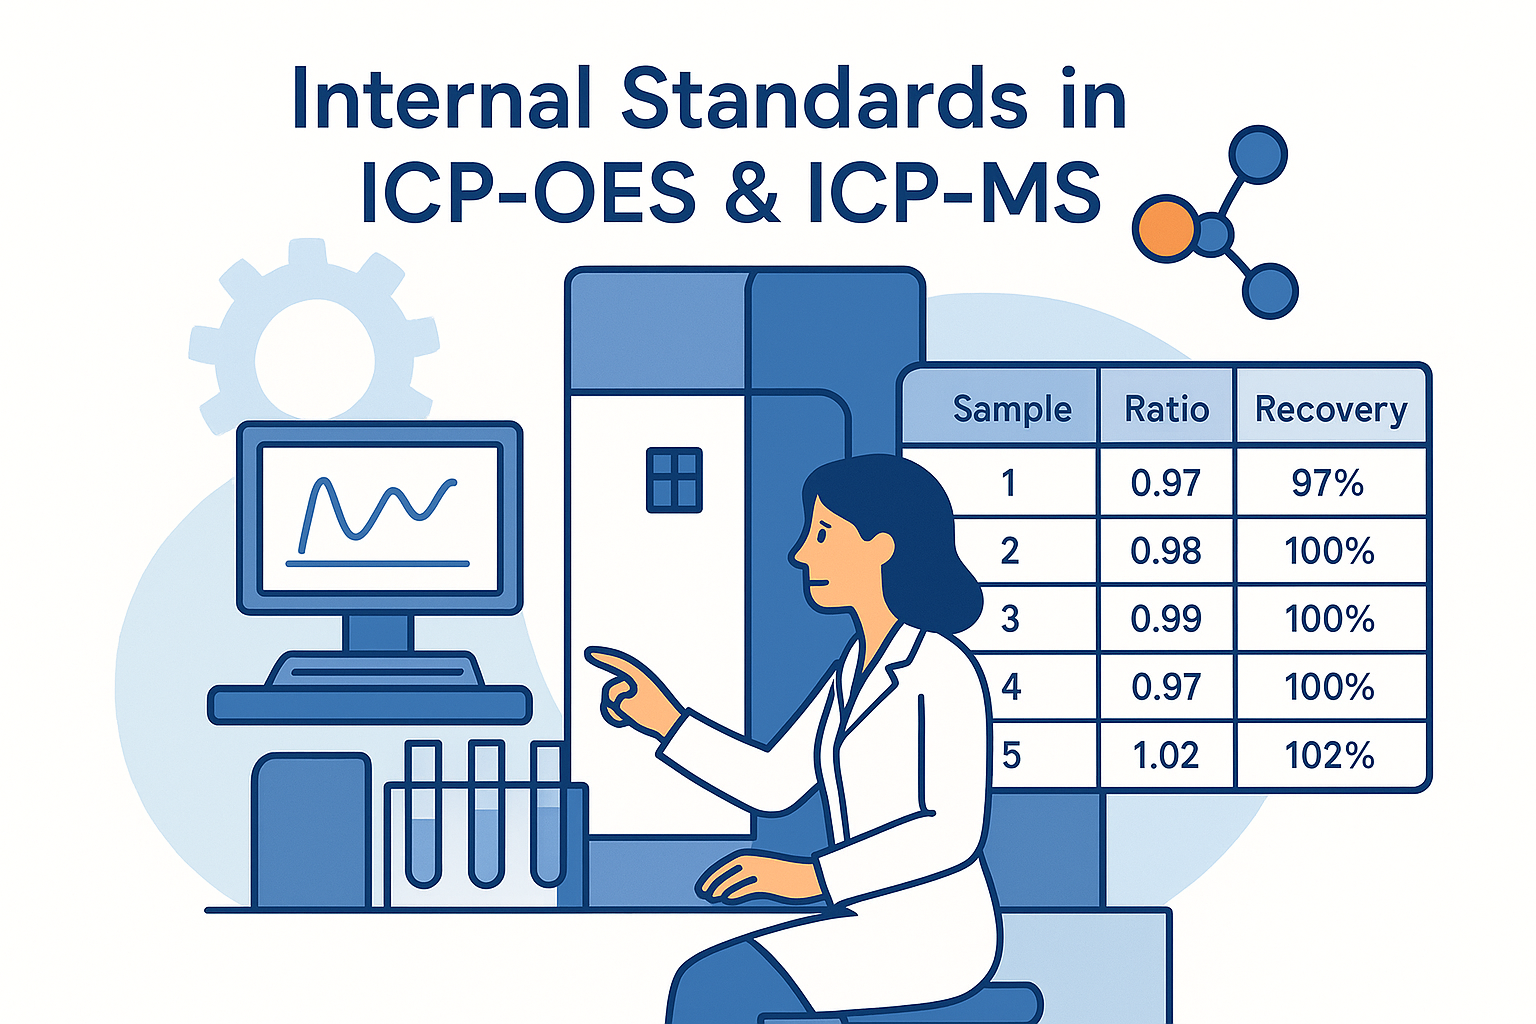
Internal Standards
By: Pablo J Lebed
Published: August 14, 2025
ICP-MS ICP-OES Internal Standard
A frequent doubt I notice from newcomers in analytical chemistry is:
“What is a good recovery ratio for my internal standard?”
Let’s use the following example with Iron (Fe) as the analyte and Yttrium (Y) as the internal standard:
| Sample | Fe [cps] | Y [cps] | Ratio | Recovery |
|---|---|---|---|---|
| 1 | 70287 | 76019 | 1.00 | 100% |
| 2 | 71040 | 77285 | 0.98 | 98% |
| 3 | 70533 | 75944 | 1.00 | 100% |
| 4 | 72763 | 78583 | 0.97 | 97% |
| 5 | 71080 | 76120 | 1.00 | 100% |
| 6 | 71275 | 76862 | 0.99 | 99% |
| 7 | 72351 | 77327 | 0.98 | 98% |
| 8 | 70893 | 76597 | 0.99 | 99% |
| 9 | 70901 | 76140 | 1.00 | 100% |
| 10 | 68757 | 74204 | 1.02 | 102% |
Table meaning:
- Fe [cps] – signal of analyte in counts per second.
- Y [cps] – signal of internal standard in counts per second.
- Ratio –
(Y [cps] of Sample 1) / (Y [cps] of sample). - Recovery – Ratio × 100.
Vendor Recommendations
Vendors often state that an acceptable ratio is between 0.8 – 1.2.
But—if no one explains why, take the advice with caution.
Why You Need Your Own Definition
When developing a method, your internal standard must show the expected behaviour:
-
Does its signal vary in the same way as your analyte?
Tip: plot a linear regression to check correlation.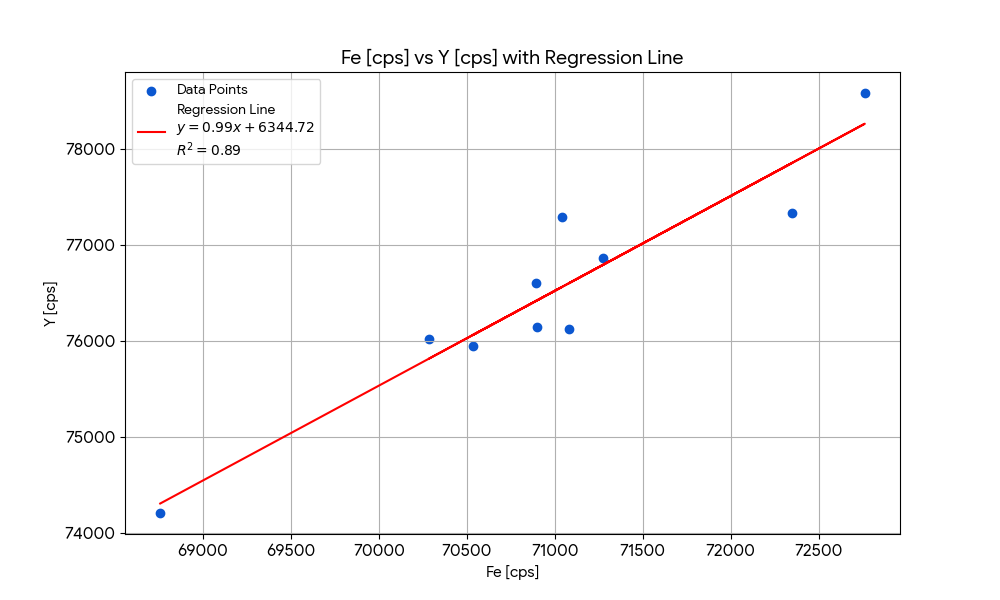
-
What recovery range works for your method?
- Spike certified solutions with substances that interfere and observe bias.
- Decide how much bias is tolerable before it impacts decisions—scientific or economic.
In Short, During Method Development:
- Find a suitable internal standard.
- Understand its behaviour in your real sample matrix.
- Define and justify your own acceptable recovery range.